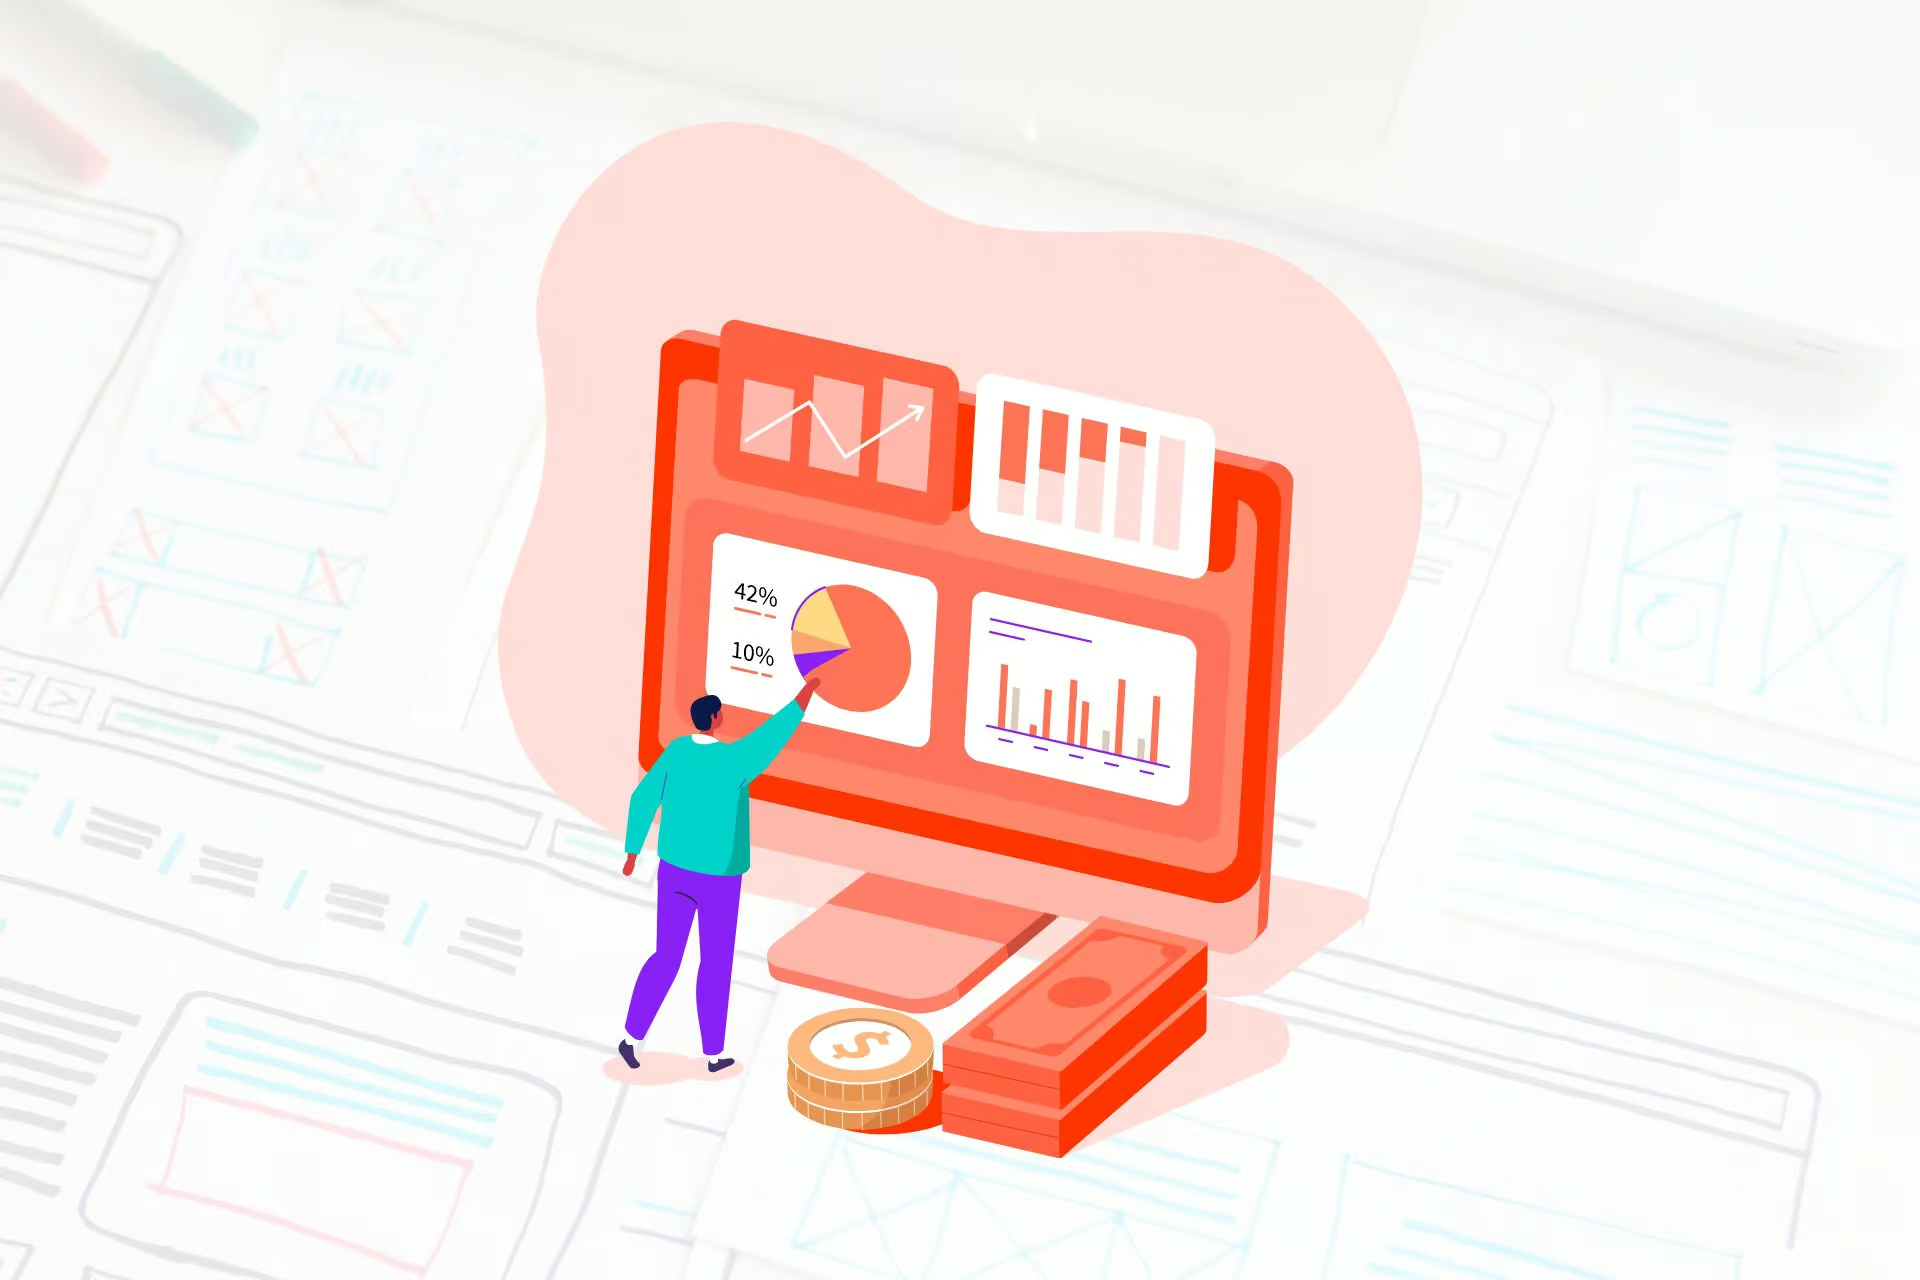
Information visualization is one of the most recent movements that inspires great design.
The visual communication of information or data can be effective, intriguing, and beautiful – or it can confusing, boring, and ugly.
Hiilite Creative Group’s William Walczak believes “everything communicates” and an effective design should speak to its audience and produce results.
Everything Communicates
Has an infographic ever caught your eye while skimming through your Facebook news feed? Has your professor ever completely lost your focus with a chart of numbers and words (that he built to engage you)? What makes one an effective form of communication and the other a negative?
Answer: design.
As creative designers, whether for branding, marketing or art, our goal is to communicate effectively through compelling imagery. We take inspiration from the world around us and past era’s of graphic design to craft visuals that produce results (whatever the desired results may be!). One era that will continue to inspire us is that of Information Visualization, 1970-2000. For more inspiration from this era check out renowned artists and authors such as, Ben Fry, Bradford Paley, George Legrady and Edward Tufte.
What is Information Visualization?
You’ve probably heard the popular phrase, “a picture is worth a thousand words,” and this couldn’t be more true when it comes to effective information visualization.
Information is defined as, “knowledge communicated or received concerning a particular fact or circumstance”. Information Visualization is the graphical or visual portrayal of data and information, such as infographics.
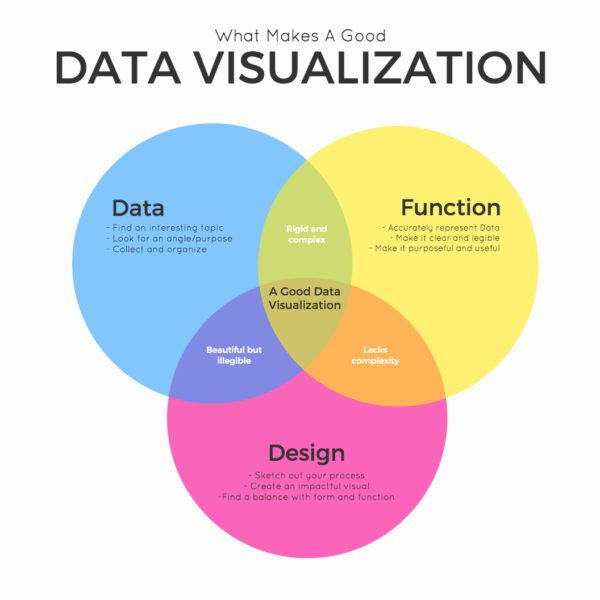
The secret to a well done infographic is in the ability to convey ideas effectively. We must achieve a balance between design and function, keeping in mind the main purpose: communication of information.
Infographic courtesy: Venngage.com | Source: Maximize Social Business
Communication through Infographics
Why?
When done right, infographics can communicate complex or “dull” information in an eye-catching and easy to understand manner. This means you can communicate your message quickly without the use of tons of text or another supporting medium, such as video. (This also means its a cheaper option!). Infographics stand out amongst the crowd of words and photos in social feeds, engaging with your audience.
When and What?
Not all information is best communicated through an infographic. They don’t replace blogs or stories, but they can support them! They work well for information that requires limited text, such as lists. See Hiilite’s own infographic below for what types of messages work best!
[WHEN TO USE AN INFORMATION VISUALIZATION INFOGRAPHIC ]- Numbers & Stats
- Timelines
- Processes
- Intricate or technical
- Comparisons
- Lists
How?
Ask us! We’ll advise you if an infographic is what you need and create it for you too. Or use a user-friendly infographic service like Venngage.